Gallery
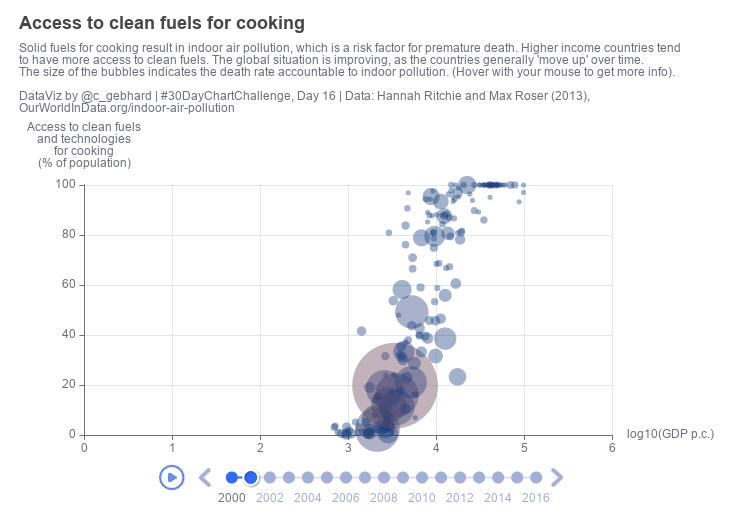
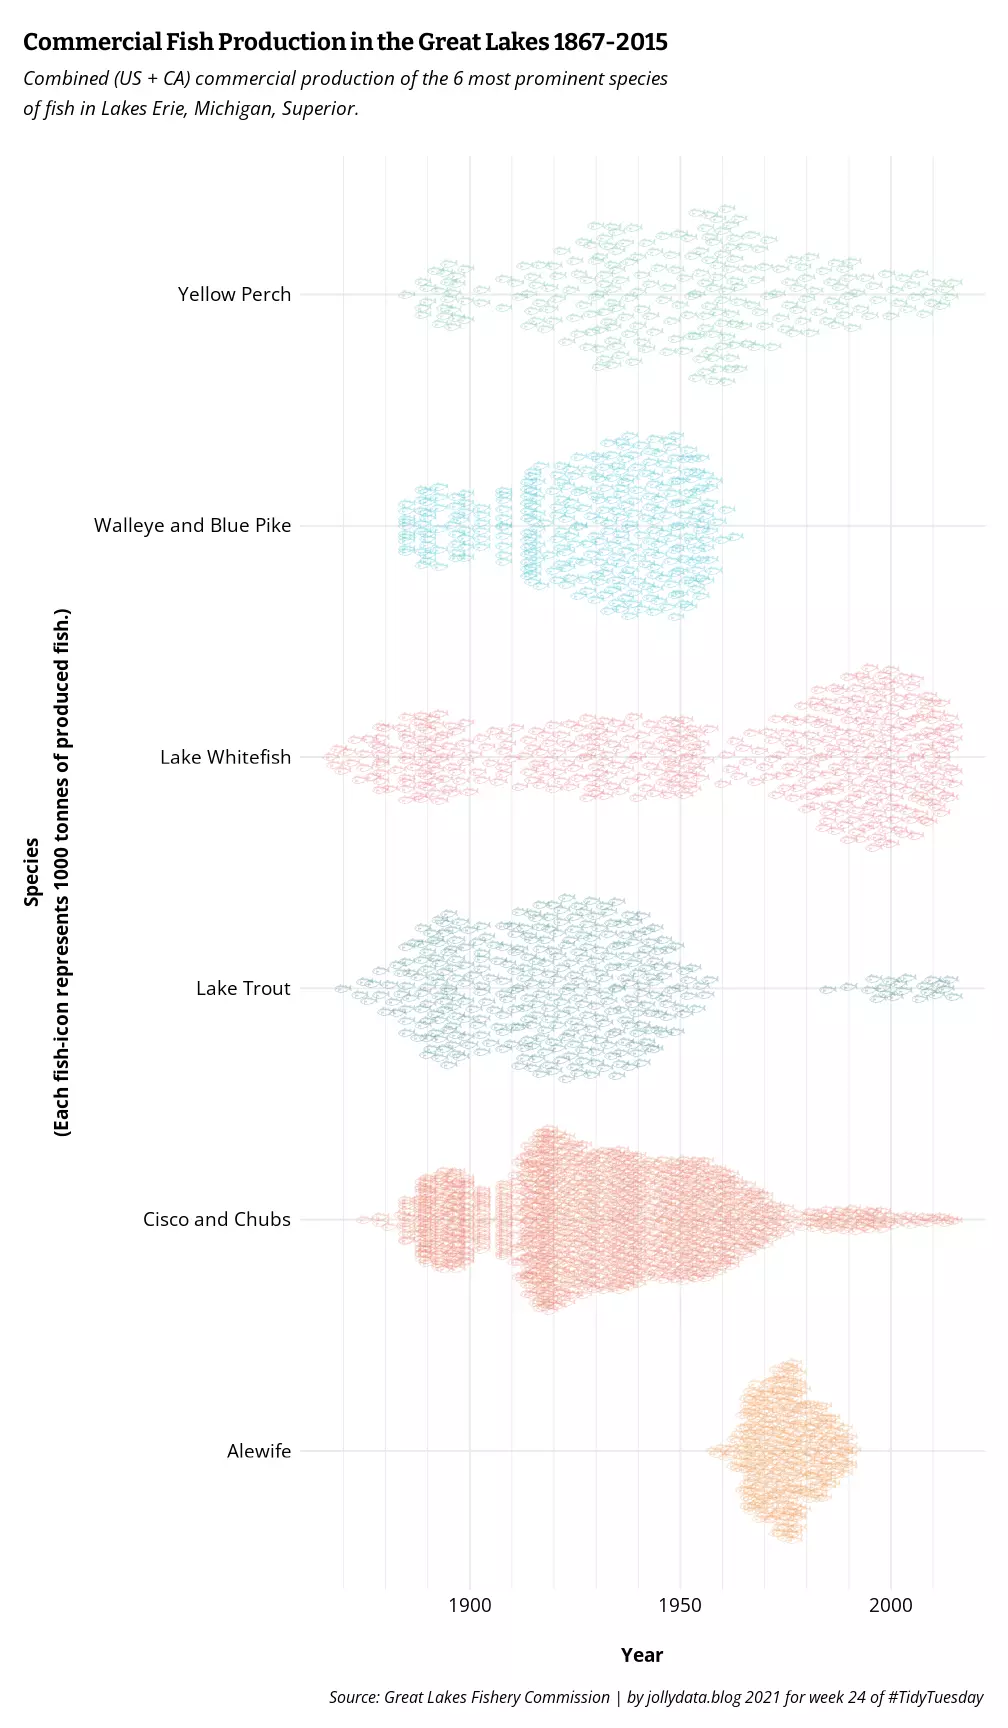
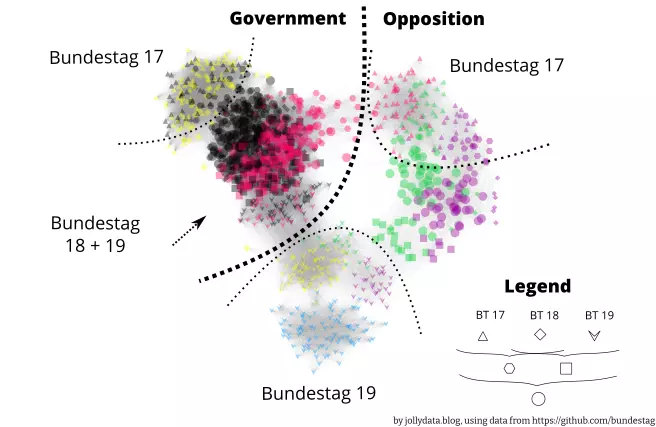
A selection of visualizations created for previous projects, dataviz-community challenges such as #TidyTuesday or the #30DayChartChallenge. The code can either be found in blog posts or on my github page. Click on any image to enlarge.
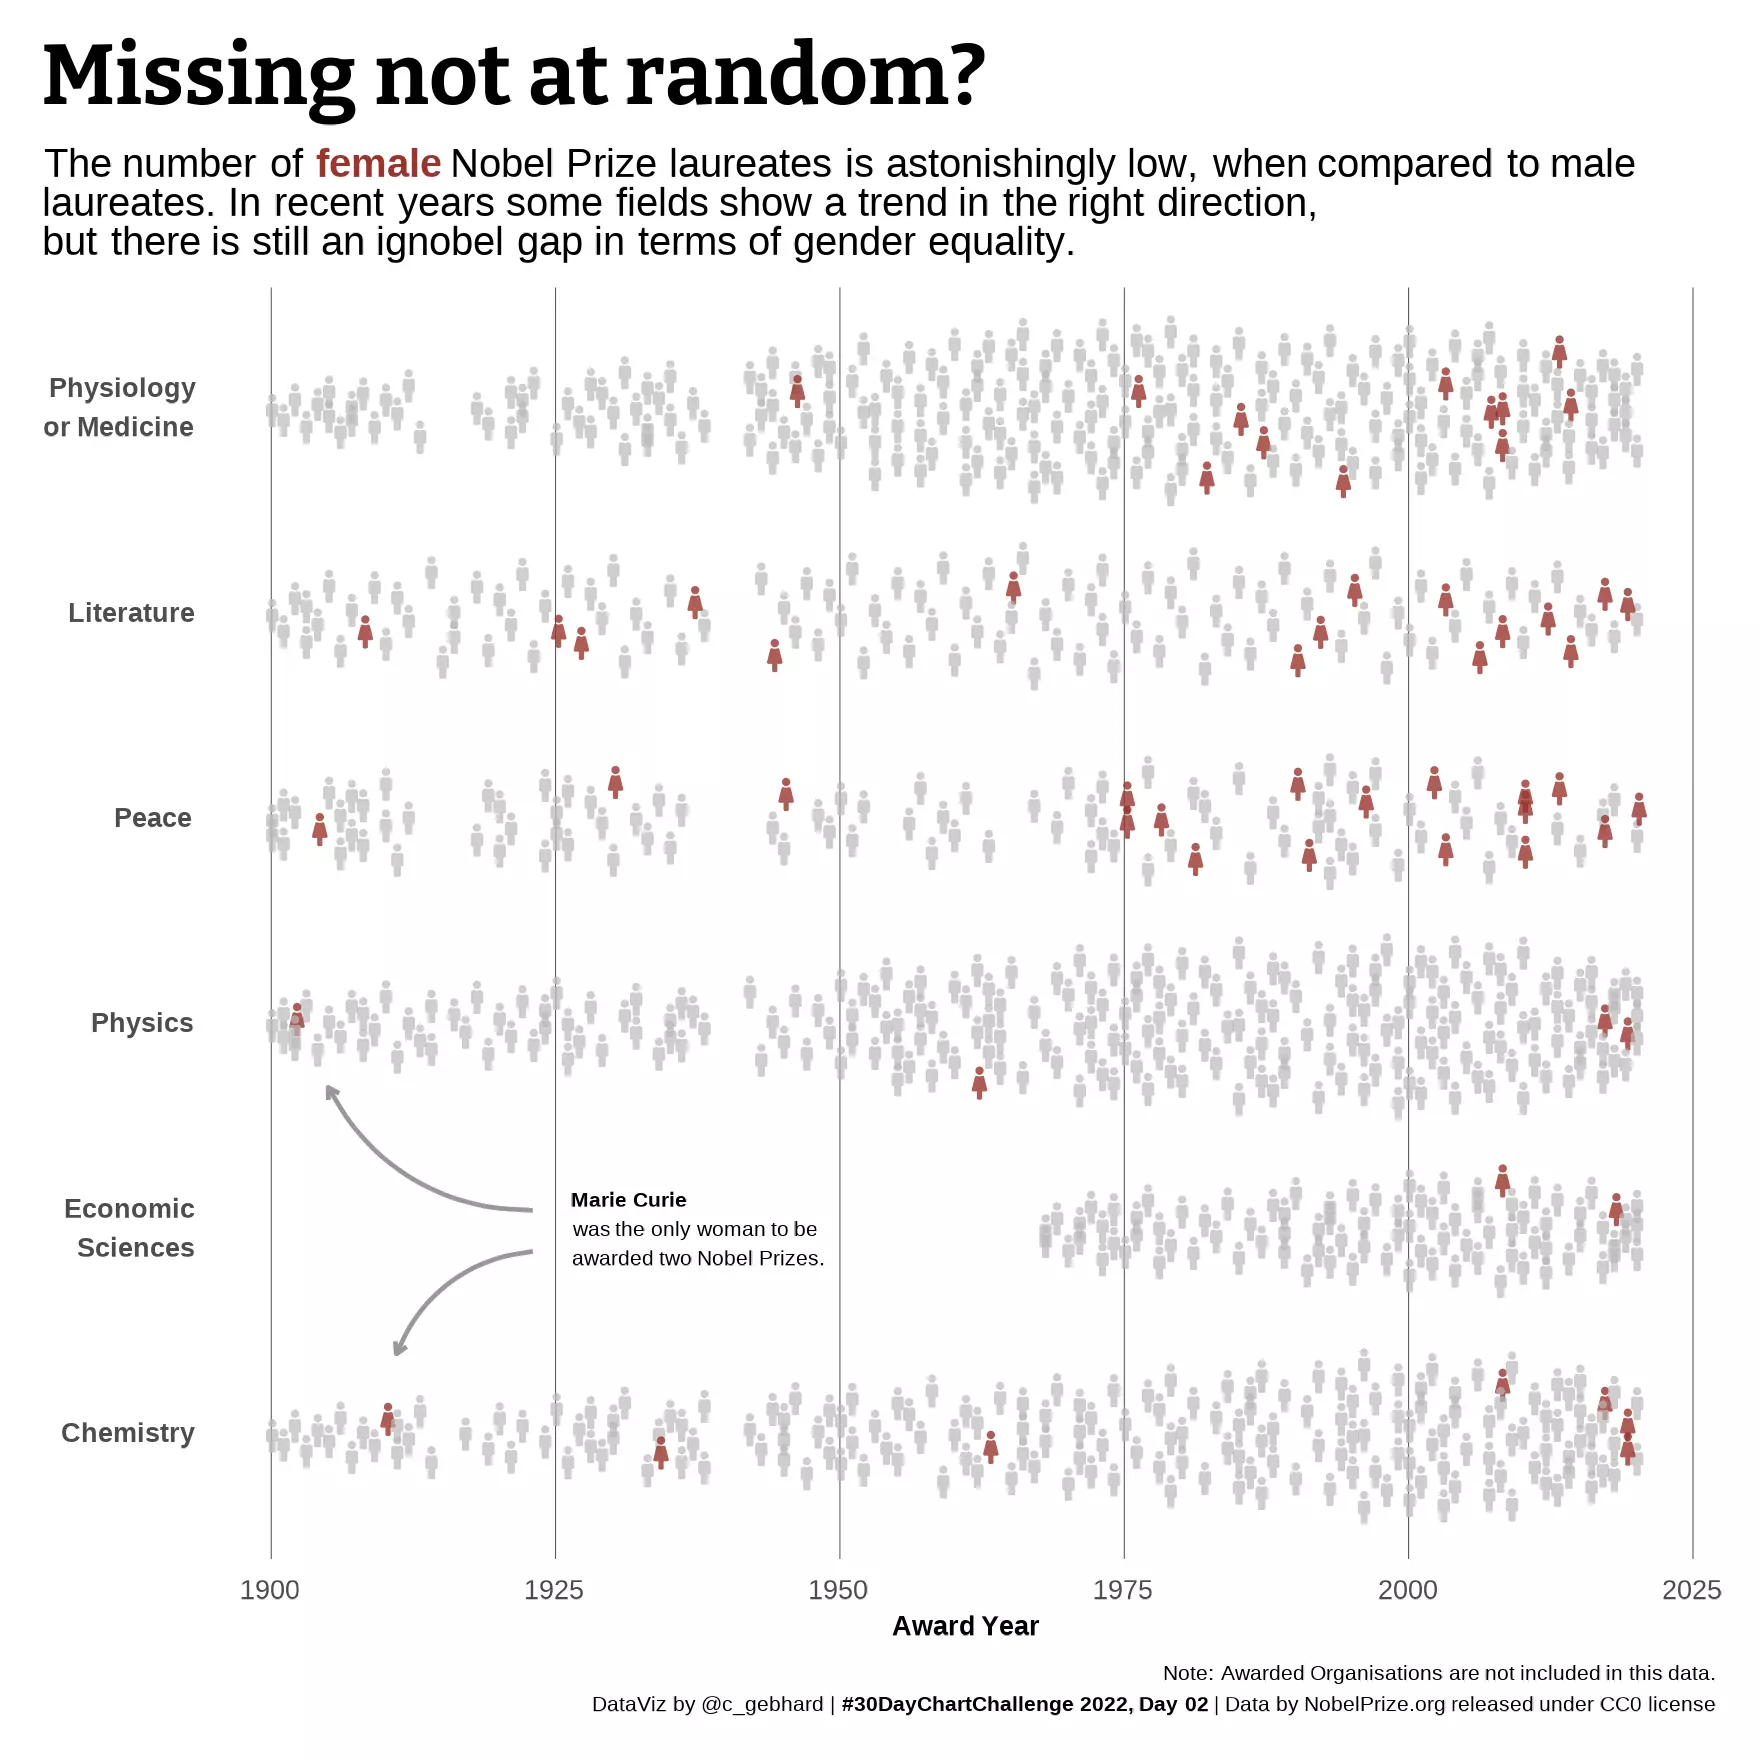
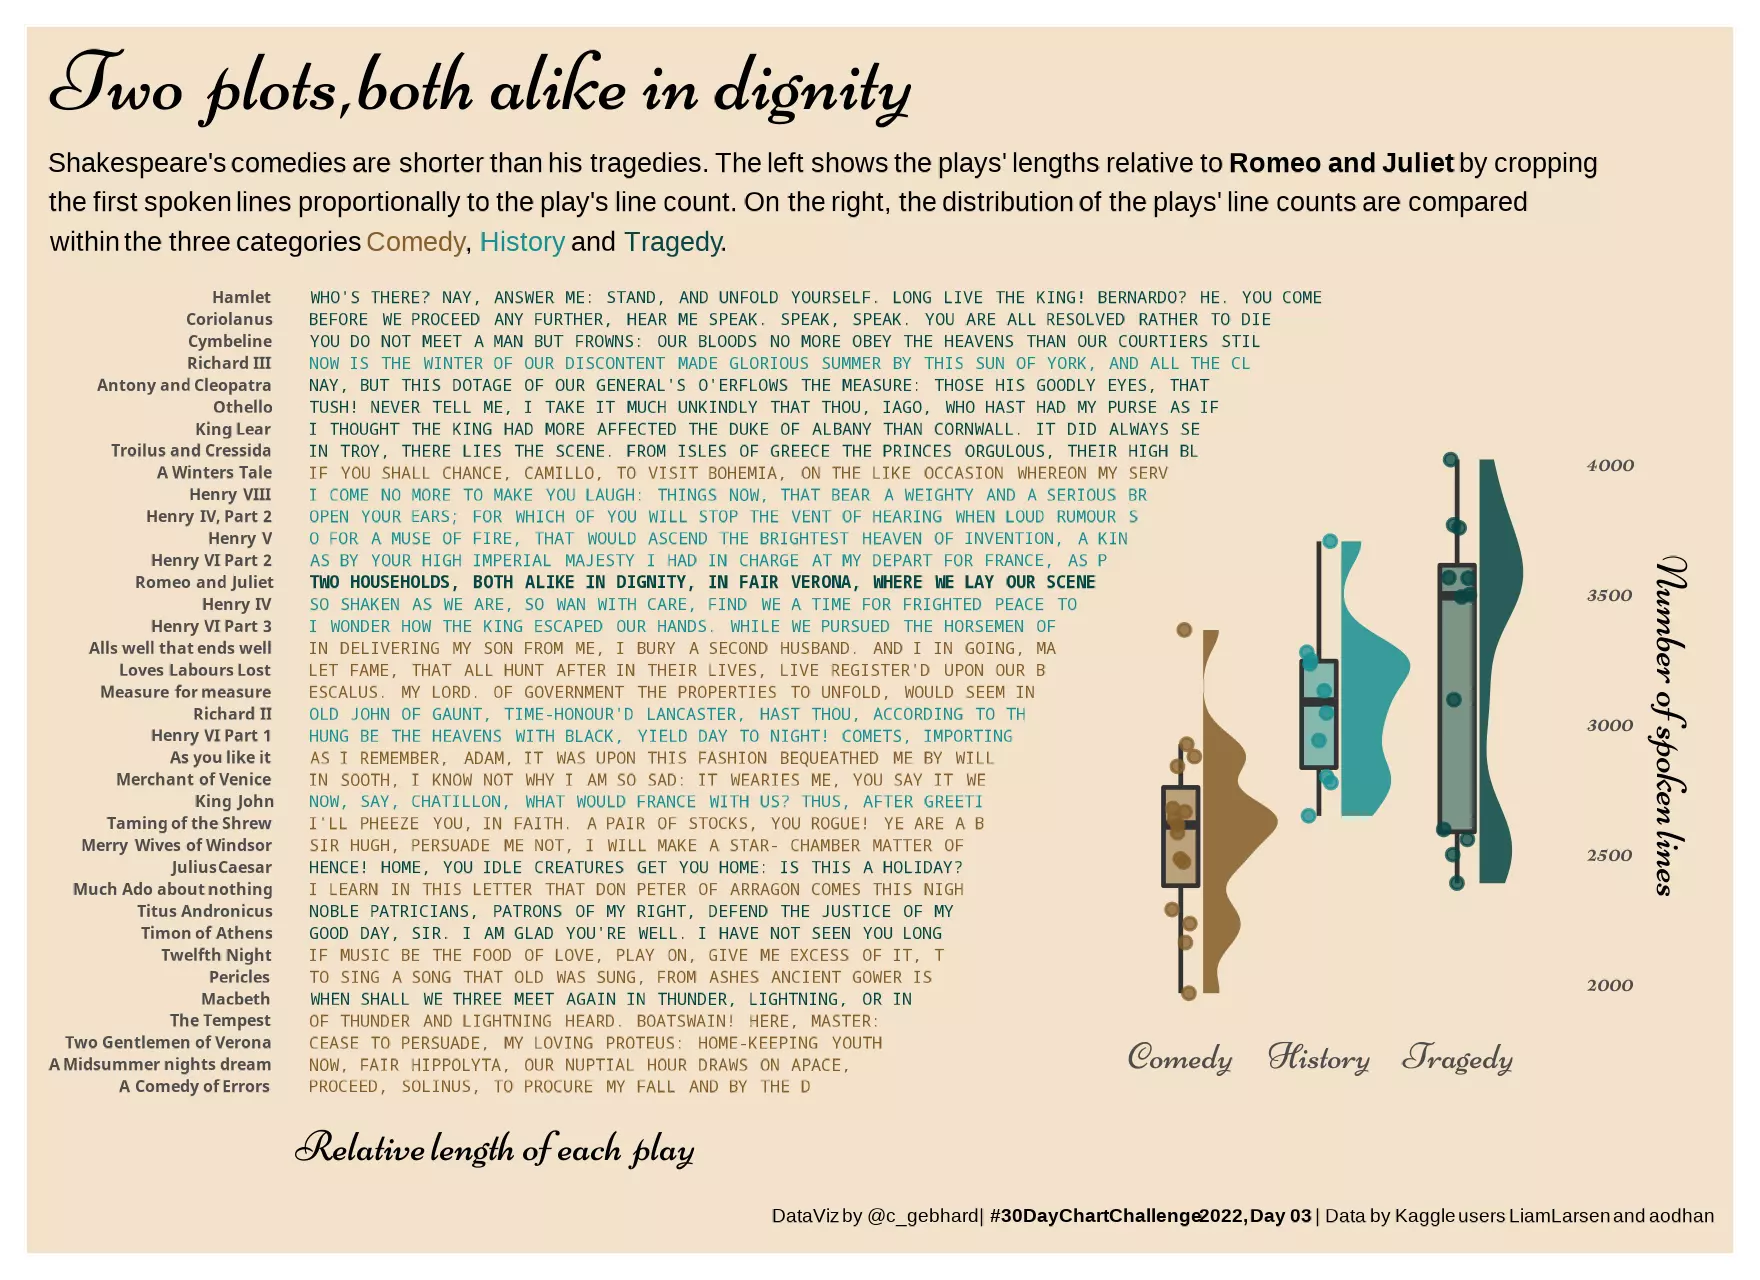
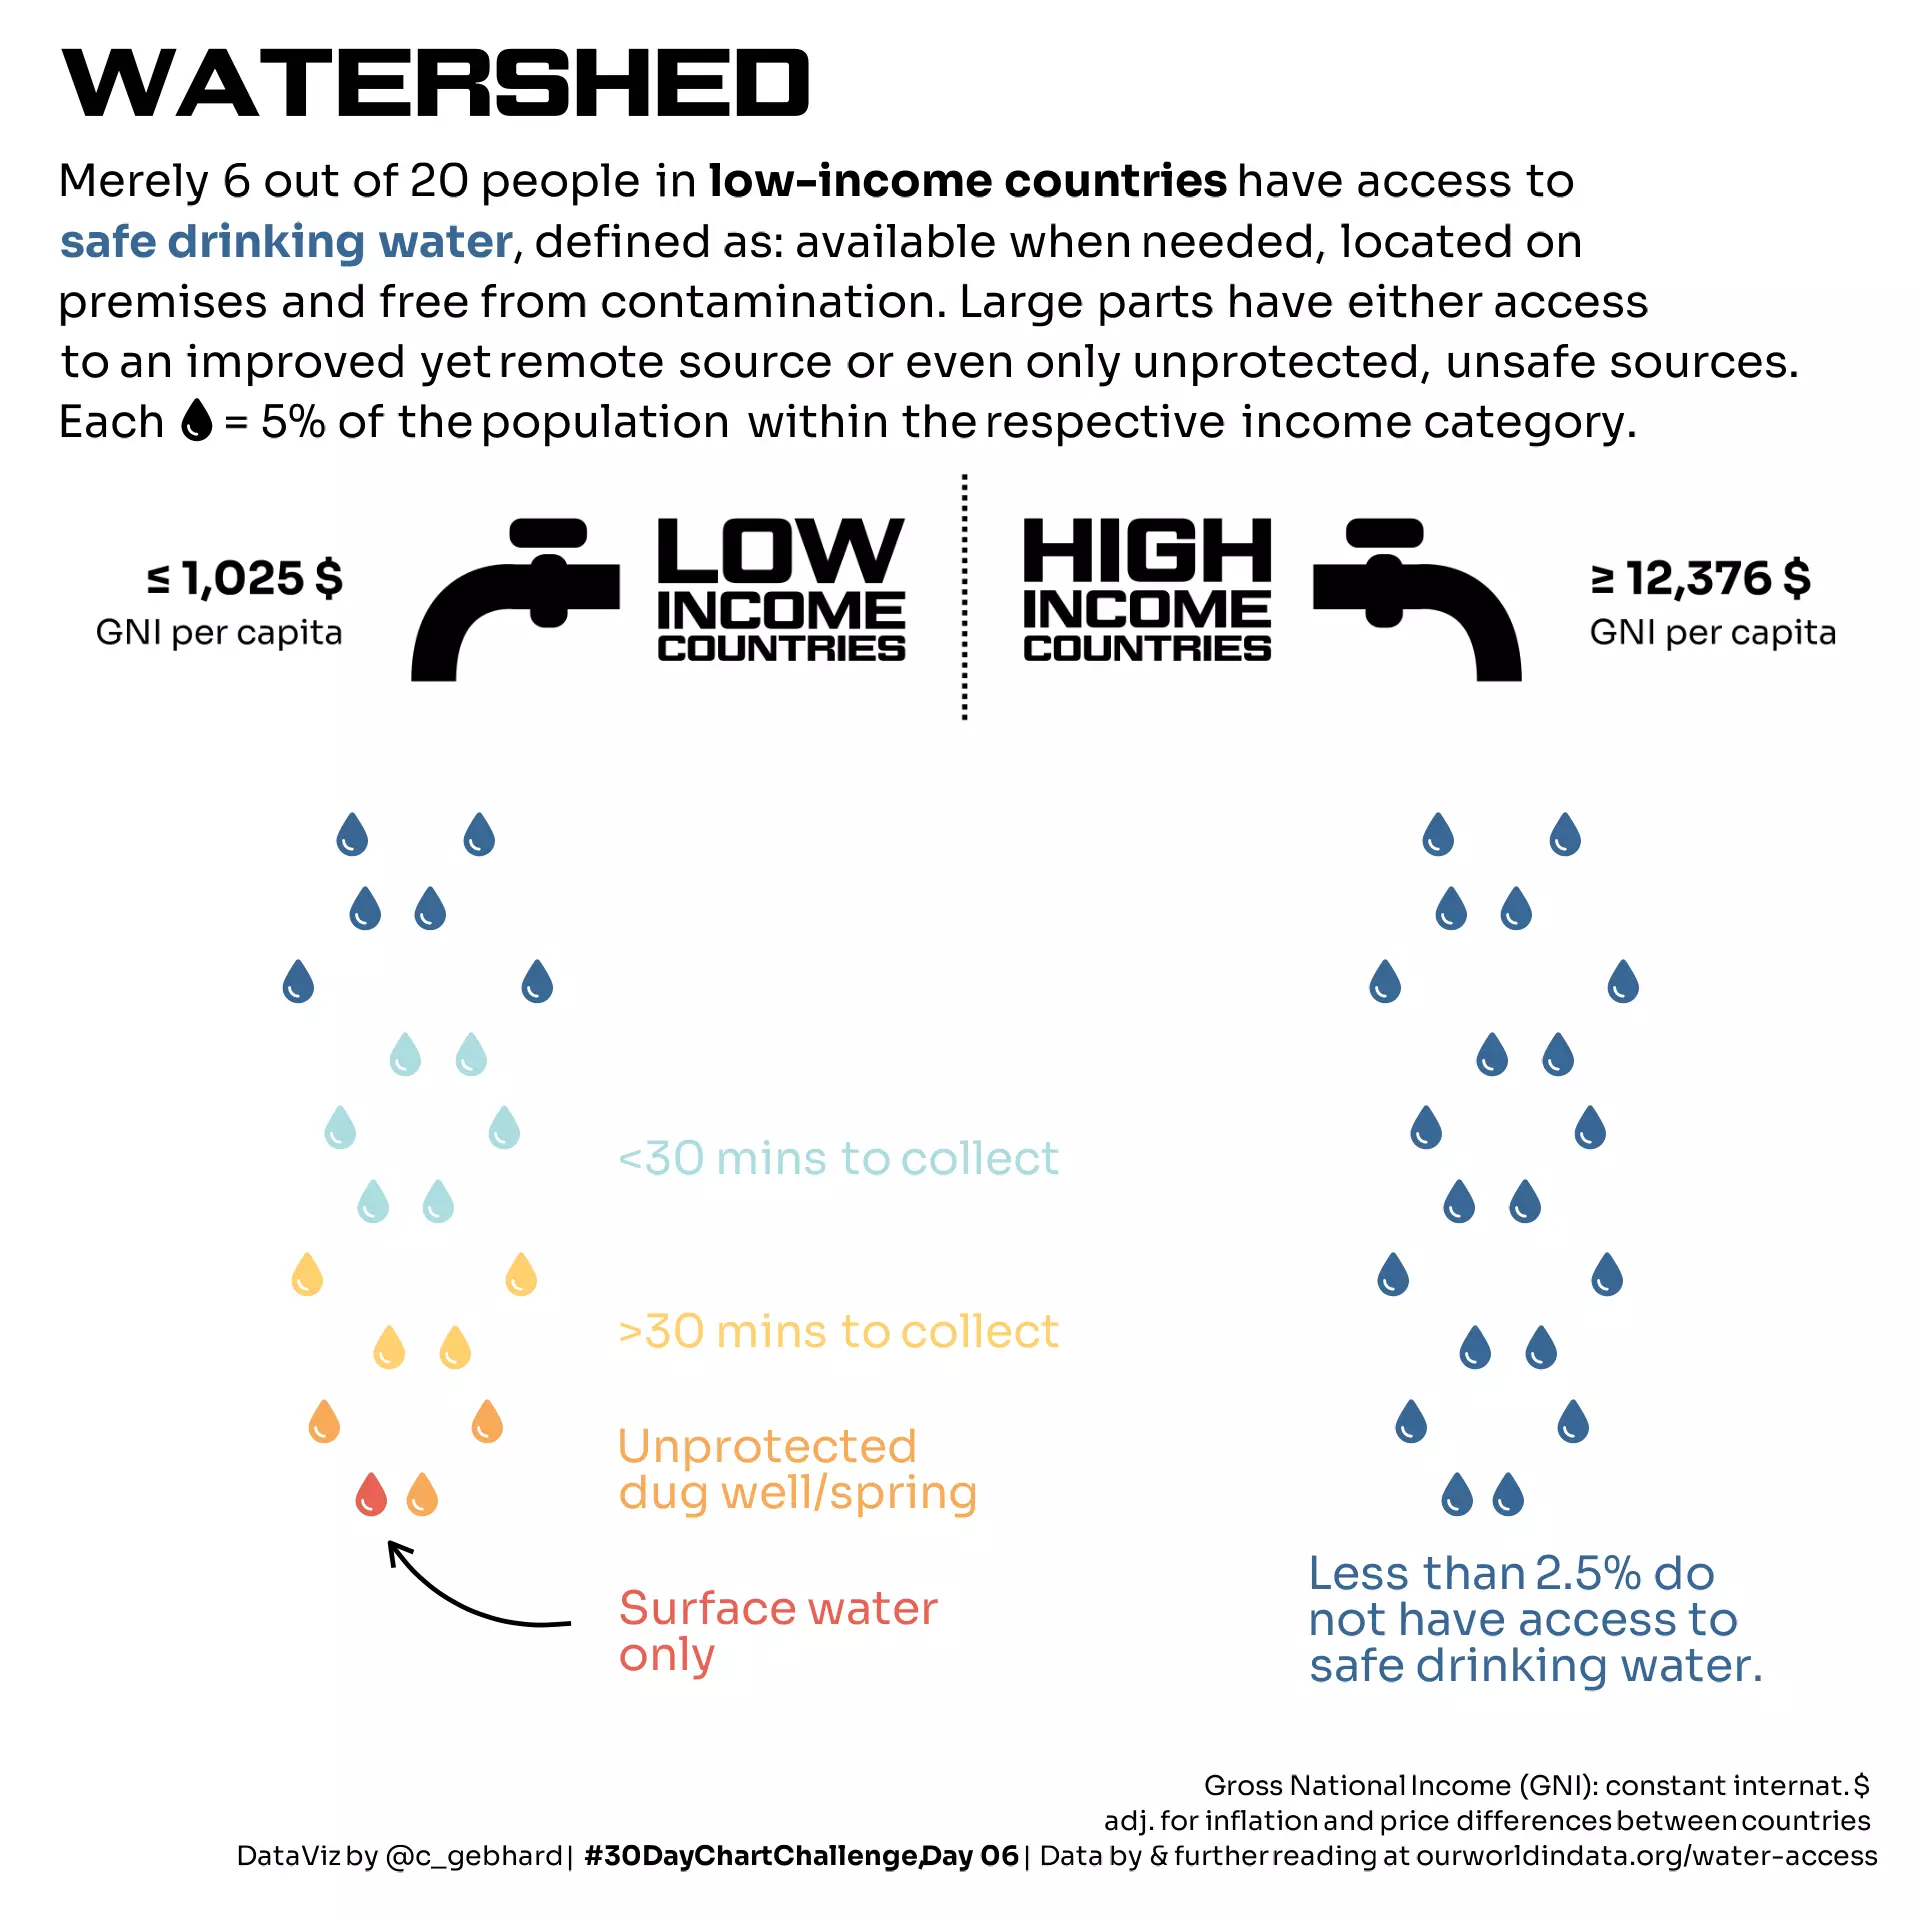
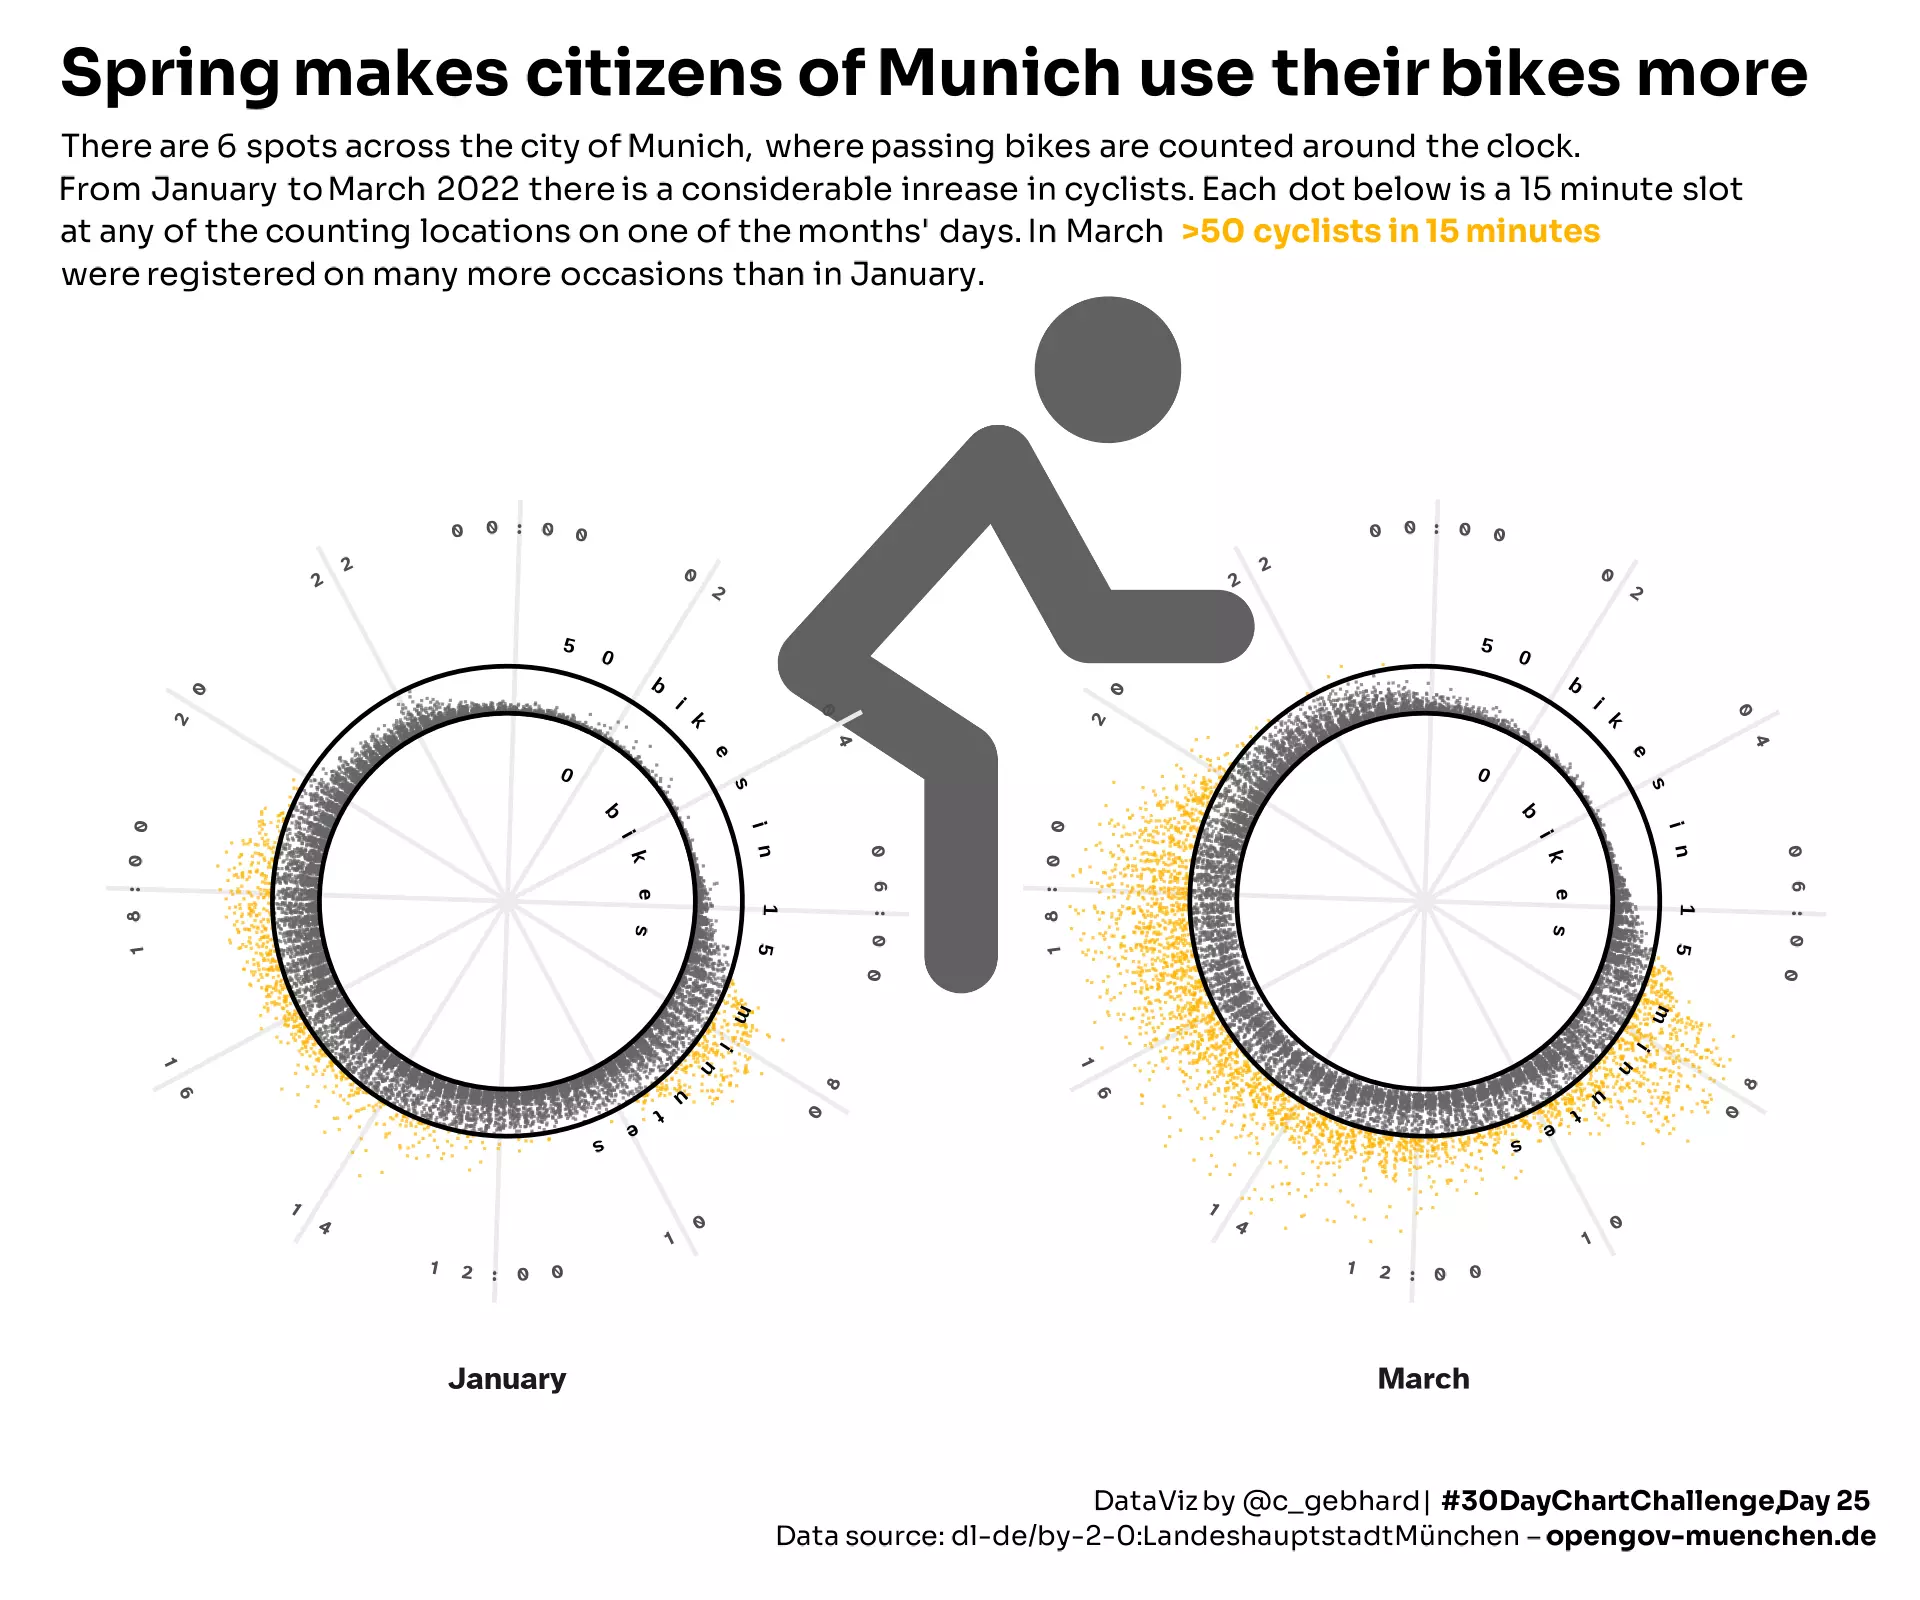
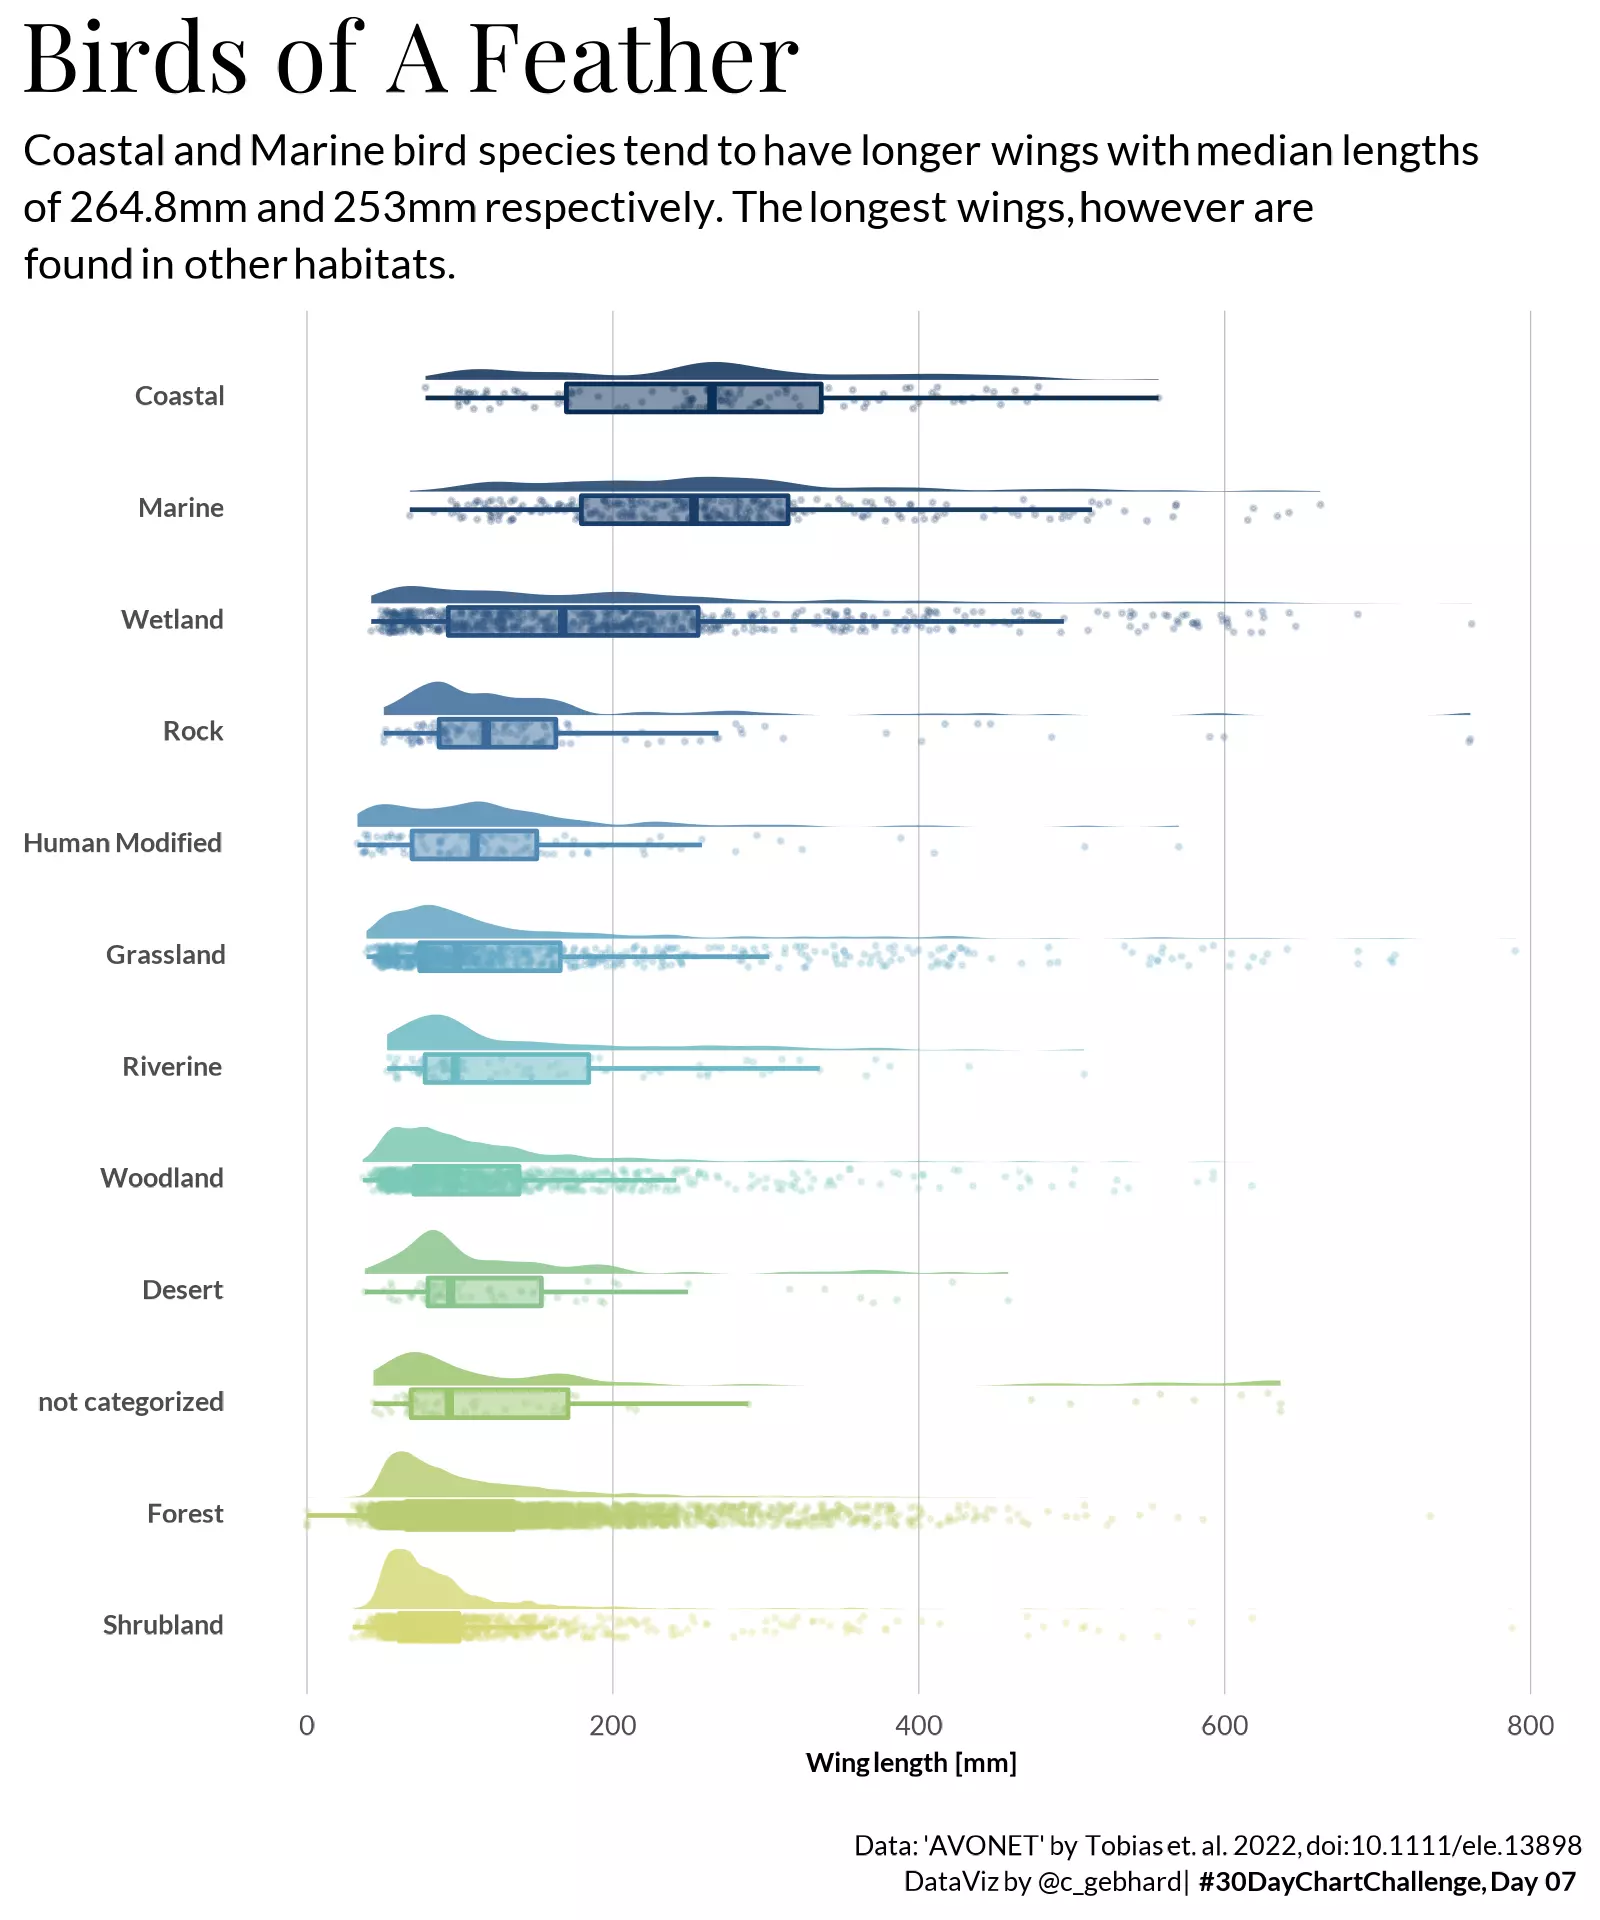
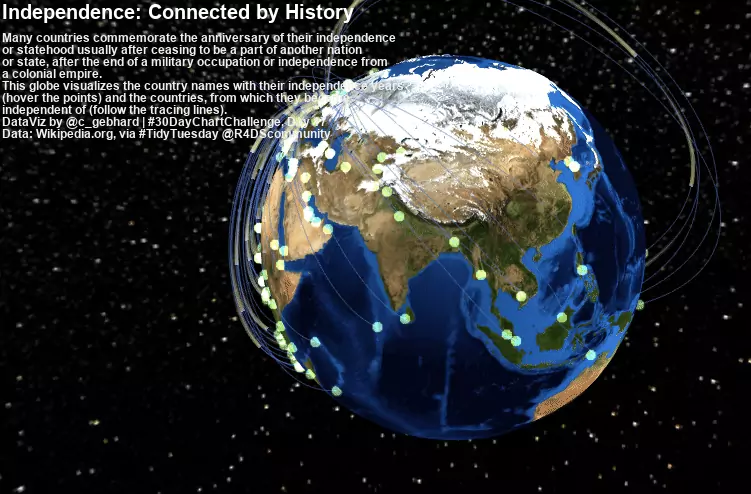
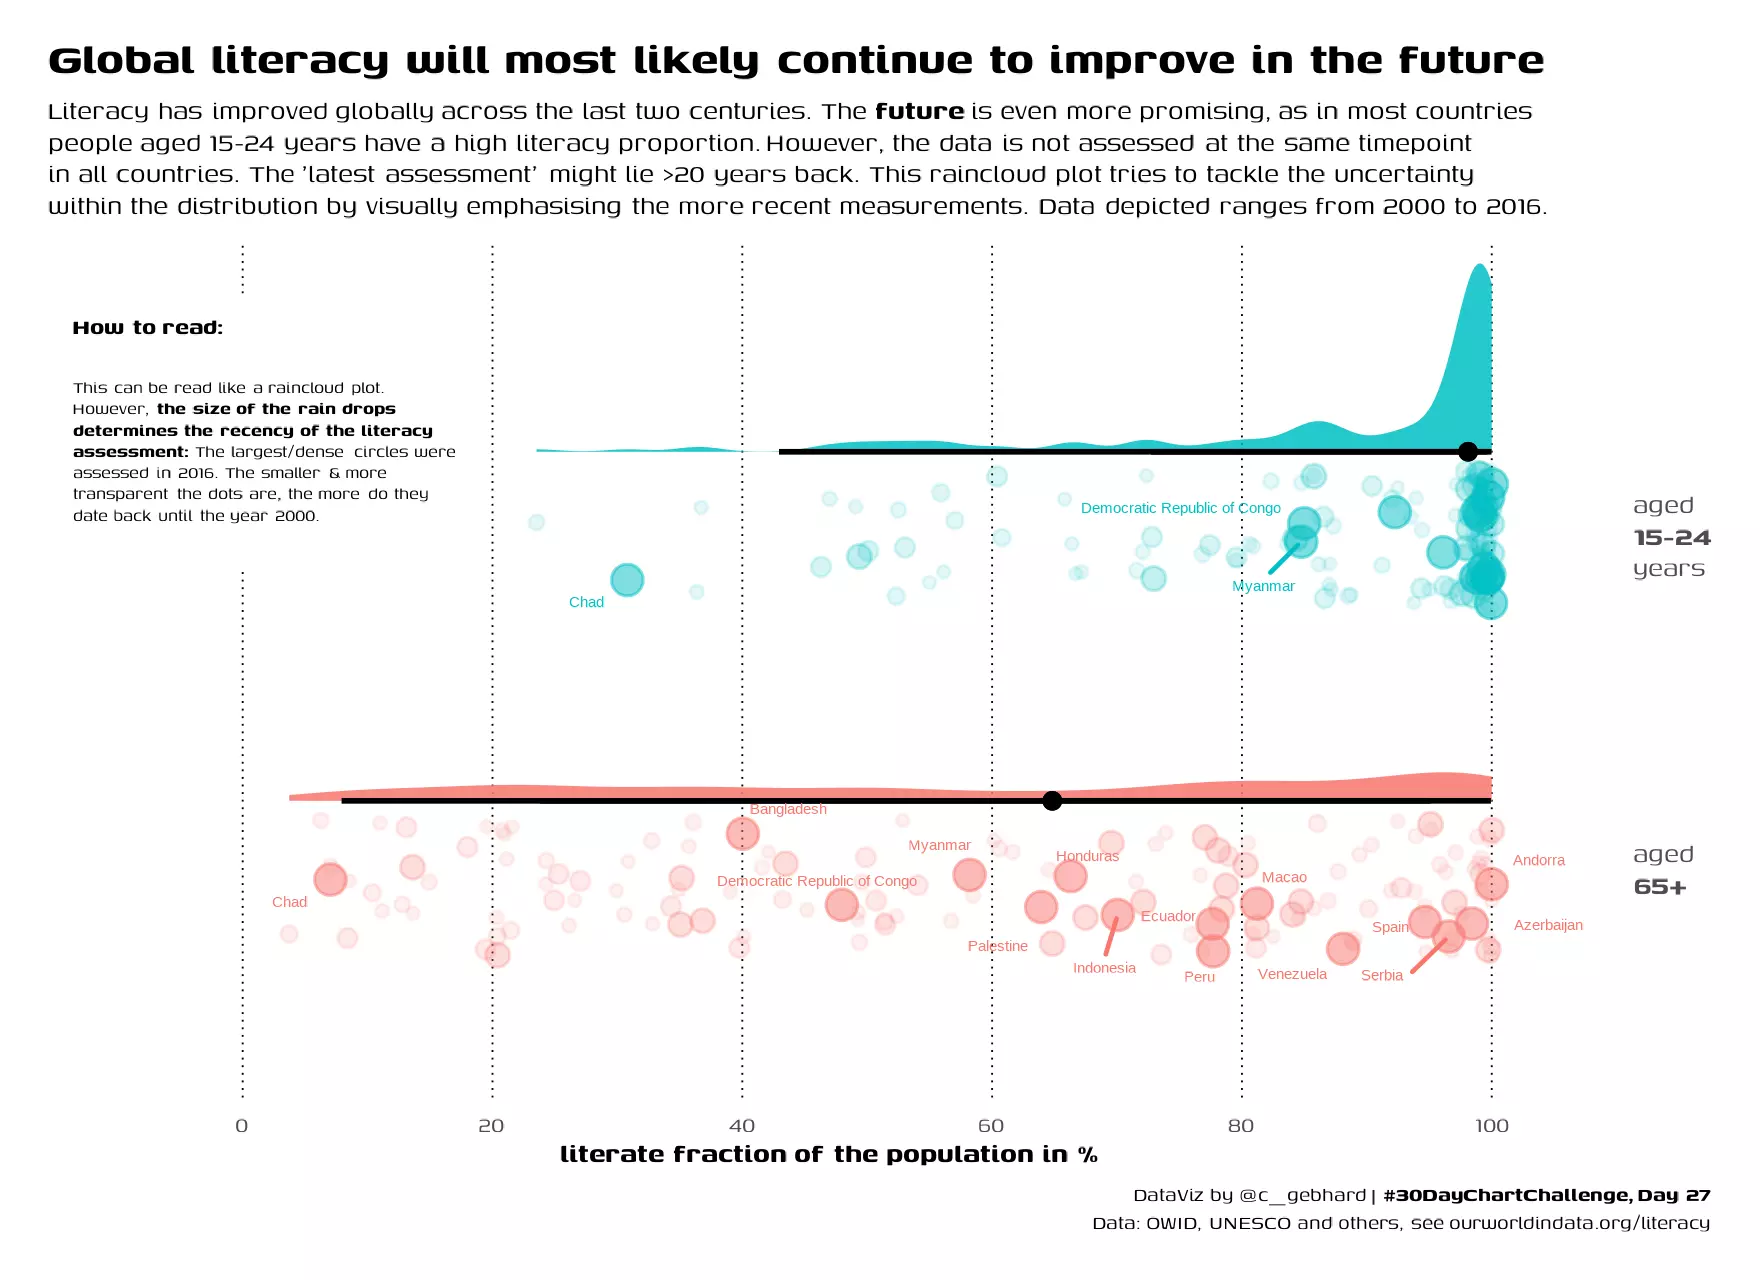
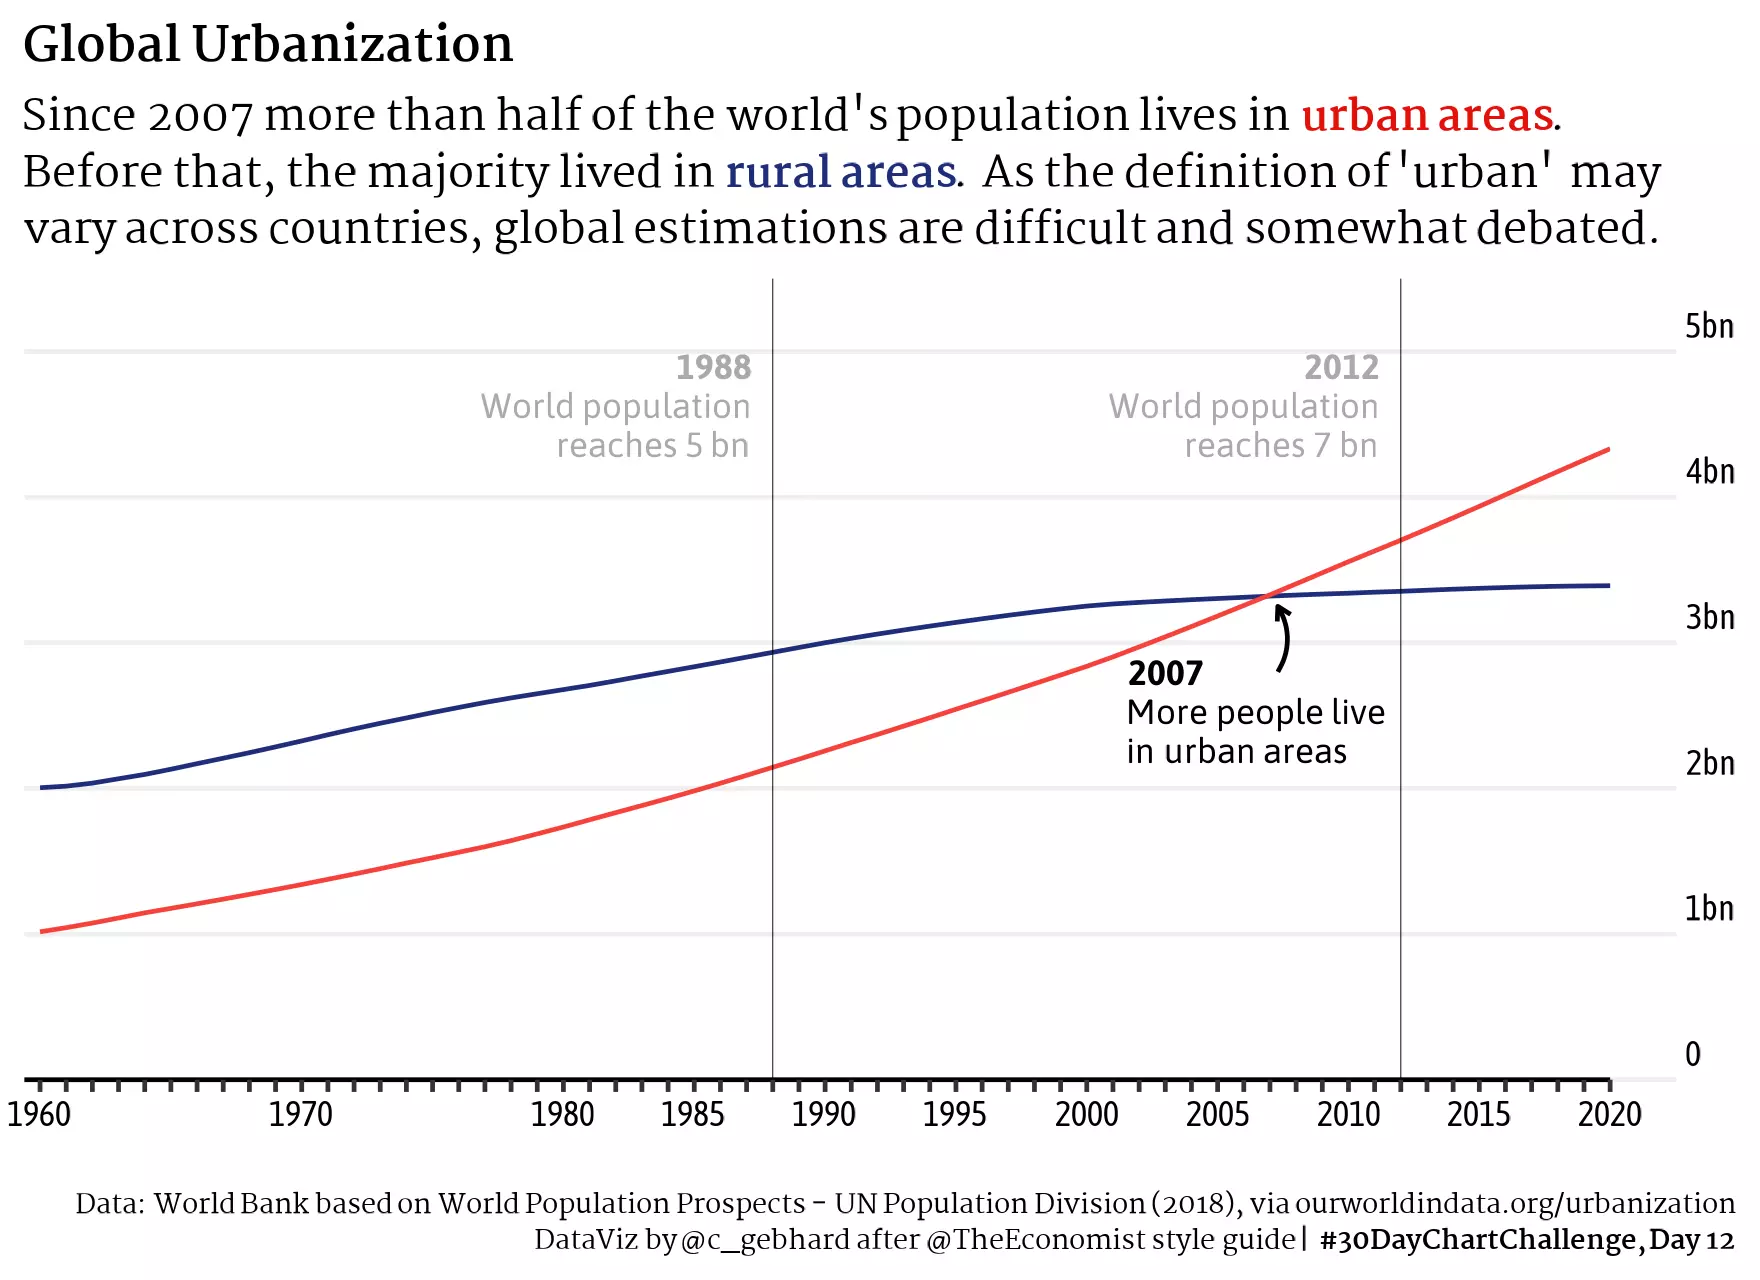


A selection of visualizations created for previous projects, dataviz-community challenges such as #TidyTuesday or the #30DayChartChallenge. The code can either be found in blog posts or on my github page. Click on any image to enlarge.
Comments
Do you like the visualizations? Seen anything you want to discuss? Leave a comment, I’d be happy to hear it!